04 Cut over
Execute the runbook you wrote in module 02 against a live write path, reset the sequences, repoint the application and the dashboard, then reconcile and stop replicating.
The leg is built and caught up. This module spends it: one window, writes stopped, the application moved to a different Postgres, and a reconciliation you can show someone.
cd "$(git rev-parse --show-toplevel)/workshops/postgres_migration"Outcome
The shop database on ClickHouse Managed Postgres taking the writer's traffic, the dashboard
serving from it with no panel SQL edited, no replication slot left on RDS, and a measured write
downtime you wrote down.
Step 1 — Execute your runbook
Open runbook/cutover.md and execute it as written. Do not improve it as you go; note what you
would change and amend it afterwards. The mechanics below are the ones your steps will reach for,
in the order most runbooks put them — but the order in your file is the one you follow.
Wait for the initial load to be done and a lag that has stopped falling before you open the window. The window's length is what you are minimizing, and every megabyte of lag you have not drained is window you will spend draining it.
Quiesce writes
kill "$(cat /tmp/writer.pid)" && sleep 3 && tail -1 /tmp/writer.logSIGTERM makes the writer finish the transactions it is inside and print a final summary, so no
order is torn. Note the committed total; you will reconcile against it.
Killing your own writer is enough in a workshop, where you are the only thing writing. On a real source it is not, because you cannot prove no other client is left. Enforce it at the database instead, which is what the migration documentation prescribes:
psql -h "$RDS_HOST" -d postgres -c "ALTER DATABASE shop SET default_transaction_read_only = on;"That takes effect for new sessions rather than existing ones, so it is a belt to the braces of stopping the application, not a substitute for it. Module 07's teardown does not need to revert it, because the database goes with the instance — but note that if you abort and roll back to RDS, this is a line your rollback has to undo, and a rollback that forgets it leaves you pointing the application at a database that refuses every write.
The window is now open. Reads never stop — Grafana keeps serving from RDS throughout.
Confirm the source and target are level
psql -h "$RDS_HOST" -At -c "SELECT pg_wal_lsn_diff(pg_current_wal_lsn(), confirmed_flush_lsn) FROM pg_replication_slots;"With writes quiesced this converges to 0 within seconds. This is the moment exactly-zero is
reachable, which is the answer to the module 02 question about the order of "quiesce" and "wait".
Fix the sequences
See it fail first. This is the insert your application is about to make — no order_id
supplied, so the column's default calls nextval(). The transaction is rolled back, so it changes
no data:
psql "$TARGET_DSN" -c "BEGIN;
  INSERT INTO orders (customer_id, status, placed_at, updated_at)
  VALUES (1, 'placed', now(), now()) RETURNING order_id;
ROLLBACK;"
ERROR: duplicate key value violates unique constraint "orders_pkey"
DETAIL: Key (order_id)=(1) already exists.Twelve million rows in the table and the sequence hands out 1. Now fix it:
psql "$TARGET_DSN" -f sql/04_sequences.sqlRun the identical insert again:
psql "$TARGET_DSN" -c "BEGIN;
  INSERT INTO orders (customer_id, status, placed_at, updated_at)
  VALUES (1, 'placed', now(), now()) RETURNING order_id;
ROLLBACK;"
order_id
----------
12047090Past the data, and rolled back again so the row does not persist. That is the whole effect of the step, in two commands.
nextval() is not transactional, so the failed attempt advances the sequence by one despite the
rollback; sql/04_sequences.sql corrects it either way. A real cutover skips both inserts.
Replication moves table data. Replicated rows are applied with their literal key values and
never call nextval(), so every sequence on the target has never issued a number — last_value is
NULL, which is what you saw in pg_sequences at the end of module 03 Step 5.
The pipe does not do this for you, and neither does any other replication tool: logical decoding carries rows, and a sequence is not a row. The ClickPipes migration documentation puts a sequence reset in its own cutover procedure for the same reason.
Skip it and the target reconciles perfectly on row counts and checksums, reports no lag, and passes every check in a data-focused runbook — then rejects the first order the application places, and every one after it up to the maximum id. Millions of failed writes on a database that looked healthy sixty seconds earlier.
Verify the fix rather than trusting it:
psql "$TARGET_DSN" -c "SELECT sequencename, last_value FROM pg_sequences WHERE schemaname = 'public' ORDER BY sequencename;"
psql "$TARGET_DSN" -c "SELECT (SELECT max(order_id) FROM orders) AS max_order_id,
  (SELECT last_value FROM orders_order_id_seq) AS seq_last_value;"
The two numbers must be equal.
Repoint the application
The writer's DSN and Grafana's datasource host both move from $RDS_HOST to $TARGET_HOST. The
role names and passwords do not change, which is why this is a host edit rather than a
configuration migration.
Both roles already hold their grants, from module 03 Step 5. A permission error here means those did not land, which that step's check finds faster than reading the DSN.
cd "$(git rev-parse --show-toplevel)/workshops/postgres_migration/app"
nohup python3 writer.py \
  --dsn "postgresql://shop_writer:${WRITER_PASSWORD}@${TARGET_HOST}:5432/shop?sslmode=require" \
  --rate 200 --concurrency 16 --report-seconds 10 \
  > /tmp/writer.log 2>&1 &
echo $! > /tmp/writer.pid
sleep 15 && tail -2 /tmp/writer.log
The window is now closed. Note the wall-clock time from the kill to that first JSON line
with a non-zero committed.
PROVISIONAL: 38 seconds of write downtime, replaced by a measured figure after the end-to-end run.
Then the dashboard. One environment variable, one recreate, and not one panel's SQL:
cd "$(git rev-parse --show-toplevel)/workshops/postgres_migration/grafana"
export SHOP_DB_HOST="${TARGET_HOST}:5432"
docker compose up -d --force-recreate
Reload the dashboard. All eight panels render, against a different database, with byte-identical SQL. Keep that in mind — module 07 does the same trick again, and the second time the SQL does not even change host.
Reconcile
Run the same file on both instances, in machine-readable form so the check below can read it:
cd "$(git rev-parse --show-toplevel)/workshops/postgres_migration"
psql -h "$RDS_HOST" -At -F'|' -f sql/05_reconcile.sql > /tmp/source.txt
psql "$TARGET_DSN"  -At -F'|' -f sql/05_reconcile.sql > /tmp/target.txt
diff /tmp/source.txt /tmp/target.txt
Each line is table|row_count|checksum. In the diff, < lines are the source and > the target.
A clean diff is not the pass condition — once the writer is on the target, orders and
order_items are expected to differ, because those rows were written after the cutover and RDS will
never see them. What must hold is narrower:
| Table | Requirement |
|---|---|
customers, products | count and checksum identical; nothing writes to them |
orders, order_items | target count greater than or equal to the source's |
Let that be checked rather than eyeballed:
awk -F'|' '
  NR==FNR { c[$1]=$2; h[$1]=$3; next }
  {
    ok = ($1 == "customers" || $1 == "products") ? ($2 == c[$1] && $3 == h[$1]) : ($2 + 0 >= c[$1] + 0)
    printf "%-12s source=%-11s target=%-11s %s\n", $1, c[$1], $2, ok ? "ok" : "MISMATCH"
    if (!ok) bad = 1
  }
  END { exit bad }
' /tmp/source.txt /tmp/target.txt && echo "reconciled" || echo "RECONCILIATION FAILED"
customers source=500000 target=500000 ok
order_items source=48251387 target=48253079 ok
orders source=12100430 target=12101106 ok
products source=20000 target=20000 ok
reconciledA useful cross-check on your own numbers: divide the extra order_items by the extra orders. It
should land between 1 and 4, averaging near 2.5, because that is what the writer inserts per order.
Anything outside that range means the surplus is not simply post-cutover traffic.
For an exact match on all four tables, capture both files inside the window, before writes resume.
About the checksum column. hashtext() returns a signed 32-bit integer, so about half its
values are negative and the sum of millions of them is a large positive or negative bigint. The
sign and the magnitude mean nothing on their own — the column is a fingerprint, only ever compared
for equality between the two sides. A count matching proves the right number of rows arrived; the
checksum proves the right rows arrived, order-independently, at one sequential scan per table,
which is what makes it affordable inside a window.
Stop replicating
The leg has done its job and the slot is now a liability rather than an asset. Delete the pipe: the
row's Actions menu on Data sources calls it Remove, the Settings tab calls it
Delete, and either does the same thing.
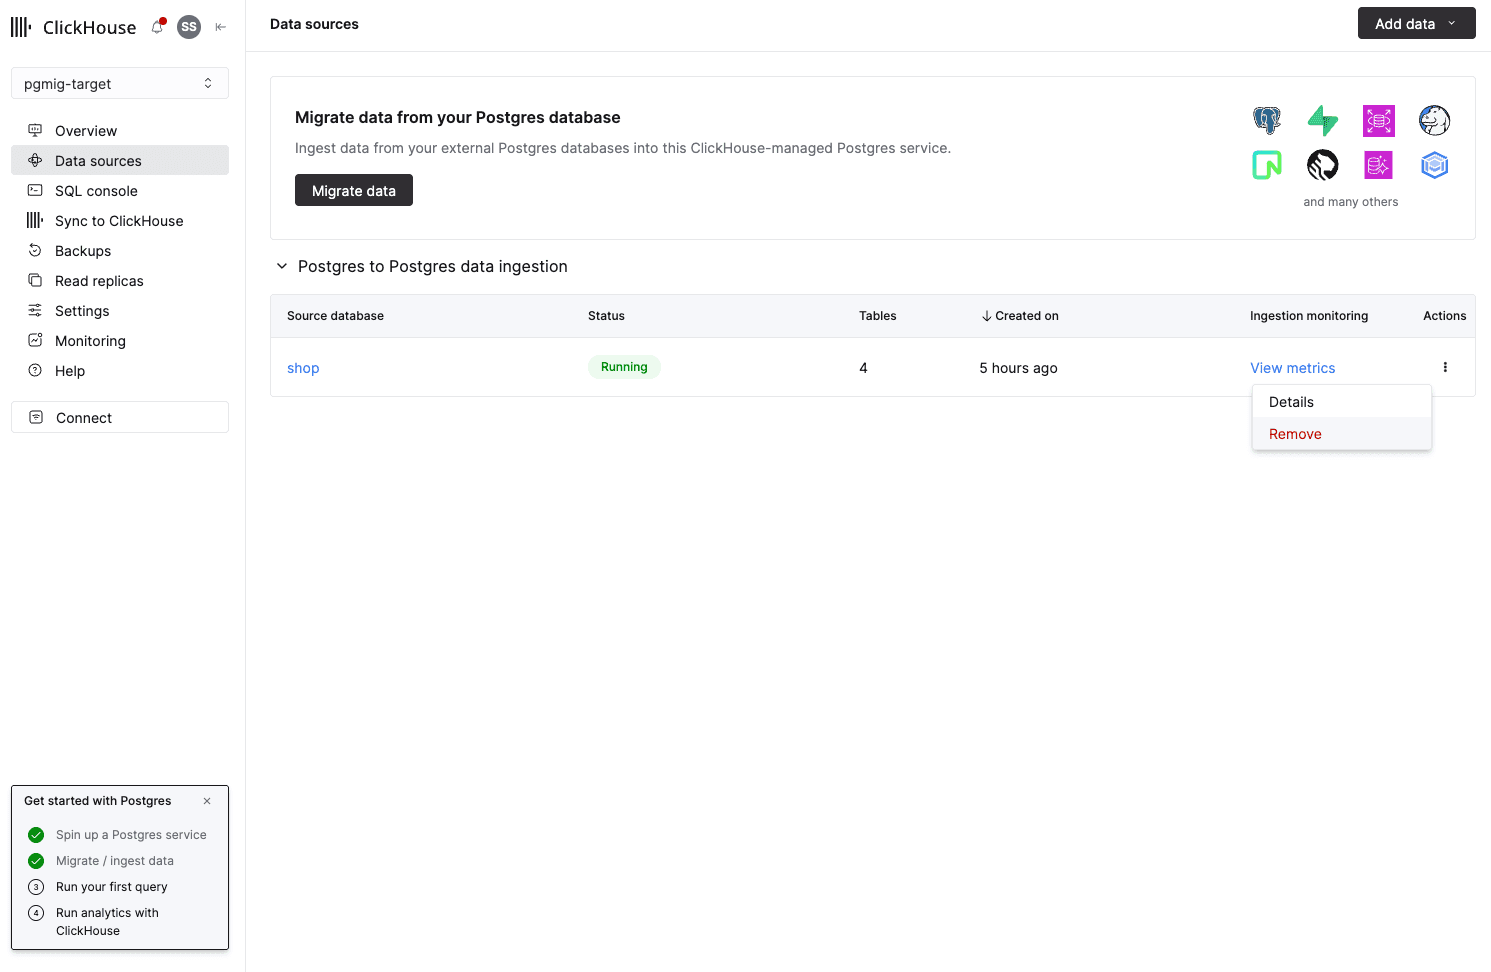
Then verify on the source that the slot went with it:
psql -h "$RDS_HOST" -c "SELECT slot_name, active FROM pg_replication_slots;"
psql -h "$RDS_HOST" -c "SELECT pubname FROM pg_publication;"
RDS must report no rows for the slot. Deleting the pipe against a reachable source drops the remote slot with it, which is what releases the WAL you watched pile up in module 03 Step 6. Do not take that on trust — checking is one query, and the failure it catches is the one that fills a disk days later with nothing left running that would explain it. If a slot is still there, drop it explicitly before you go any further:
psql -h "$RDS_HOST" -c "SELECT pg_drop_replication_slot('<slot_name>');"The publication does outlive the pipe, and that is fine. You will see one with a generated name
like peerflow_pub_mirror_de64e41d__…, which is how you can tell it was the pipe's rather than
yours. WAL is retained by slots, not by publications, so a publication with no slot behind it holds
nothing and costs nothing. Drop it only if you want the source left tidy:
psql -h "$RDS_HOST" -c "DROP PUBLICATION <pubname>;"Step 2 — Amend your runbook
Go back to runbook/cutover.md and write down what you got wrong. Specifically: was the sequence
step in your window before you executed it, or did you add it here? Was your expected downtime
close? Did your abort criteria cover what Step 6 showed you?
The model runbook, with the reasoning behind each line, is in the reference track. Read it now, against your executed one.
What this bought you, cited rather than measured
You have moved a live OLTP workload onto a different Postgres. The obvious question is what that is worth, and the honest answer is that this workshop does not measure it — it cites it.
PostgresBench is ClickHouse's public, reproducible benchmark for managed Postgres services,
built on pgbench with its TPC-B-like workload. Filter state for the figures below, because a
benchmark without its configuration is not a result:
| Filter | Value |
|---|---|
| Instance size | 4 vCPU / 16 GB, and 16 vCPU / 64 GB |
| Region | us-east-2 |
| High availability | disabled |
| Postgres version | 17 or 18, depending on what each provider supports |
| Workload | pgbench, TPC-B-like |
| Reported | TPS, average latency, latency standard deviation, P95, P99, failed transactions, load time |
| Working set | Managed Postgres by ClickHouse | AWS RDS | Aurora | Crunchy Bridge | Neon |
|---|---|---|---|---|---|
| about 100 GB | 28,668 TPS | 8,133 | 12,628 | 14,790 | 8,563 |
| about 500 GB | 26,328 TPS | 5,092 | 10,402 | 11,113 | 7,802 |
Roughly 3.5x to 5x RDS at the same instance size, and the gap widens as the working set outgrows
memory — which is the regime your order_items table is in.
- postgresbench.clickhouse.com — the live results, with its Methodology and Reproduce pages linked from the site
- The PostgresBench announcement
- ClickHouse/PostgresBench — the harness itself
Read the narrowing carefully, because it is the whole reason this is cited and not claimed.
PostgresBench measures pgbench transactional throughput. It substantiates exactly one sentence:
Managed Postgres takes roughly 3.5 to 5 times the write throughput of RDS at the same instance
size. It says nothing about dashboard latency, nothing about analytical query performance, and
nothing about the numbers you measured in module 01. Do not let anyone — including yourself — quote
it as evidence that your dashboard got faster by moving Postgres. Your dashboard has not got faster.
Module 05 opens by making that point deliberately, and module 06 is where the analytical half of
the problem is actually solved.
Done when
- the writer is committing against
$TARGET_HOSTwithfailedat zero; - every sequence's
last_valueequals its table'smax(id); - Grafana renders all eight panels against
$TARGET_HOSTwith no panel SQL edited; - the reconcile check prints
reconciled; pg_replication_slotson RDS returns no rows; andrunbook/cutover.mdrecords your measured downtime and what you would change.
Next: module 06 streams the analytical copy into ClickHouse — the same product you just used, with a ClickHouse destination instead of a Postgres one, doing a different job. It needs no downtime at all, because nothing cuts over.