04 Benchmark in the dashboard
Compare equivalent Databricks and ClickHouse queries through MigrationRoom.
Outcome
MigrationRoom's Benchmark view compares the same logical workload on Databricks and the unoptimized ClickHouse target, with correctness and timing type understood before any performance claim.
Step 5 — Benchmark
Confirm Edit · OLAP contains the approved Step 4 rewrites and that the active conversation still refers to the migration run from Step 2. Do not click Benchmark until you have recorded both compute envelopes.
Record both compute envelopes
Hardware and service configuration materially affect the result. MigrationRoom's
Terraform defaults the Databricks side to a serverless 2X-Small SQL warehouse with a
10-minute auto-stop. The ClickHouse target is supplied separately, so its size varies
by participant.
Open the Databricks SQL warehouse details for the source configuration. For ClickHouse, open the Cloud SQL console and run this bounded, read-only query before the benchmark:
SELECT
    hostName() AS replica,
    version() AS clickhouse_version,
    round(maxIf(value, metric = 'CGroupMaxCPU'), 2) AS effective_vcpus,
    formatReadableSize(toUInt64(maxIf(value, metric = 'CGroupMemoryTotal'))) AS effective_memory,
    formatReadableSize(toUInt64(maxIf(value, metric = 'CGroupMemoryUsed'))) AS memory_used
FROM clusterAllReplicas(default, system.asynchronous_metrics)
WHERE metric IN ('CGroupMaxCPU', 'CGroupMemoryTotal', 'CGroupMemoryUsed')
GROUP BY replica, clickhouse_version
ORDER BY replica
LIMIT 100
SETTINGS max_execution_time = 10,
         max_rows_to_read = 100000,
         max_result_rows = 100,
         result_overflow_mode = 'break';
Each result row is one active replica. effective_vcpus and effective_memory are the
current cgroup limits seen by ClickHouse, so they describe the compute that can execute
the benchmark more accurately than a service-size label. memory_used is a point-in-time
sanity check, not provisioned capacity.
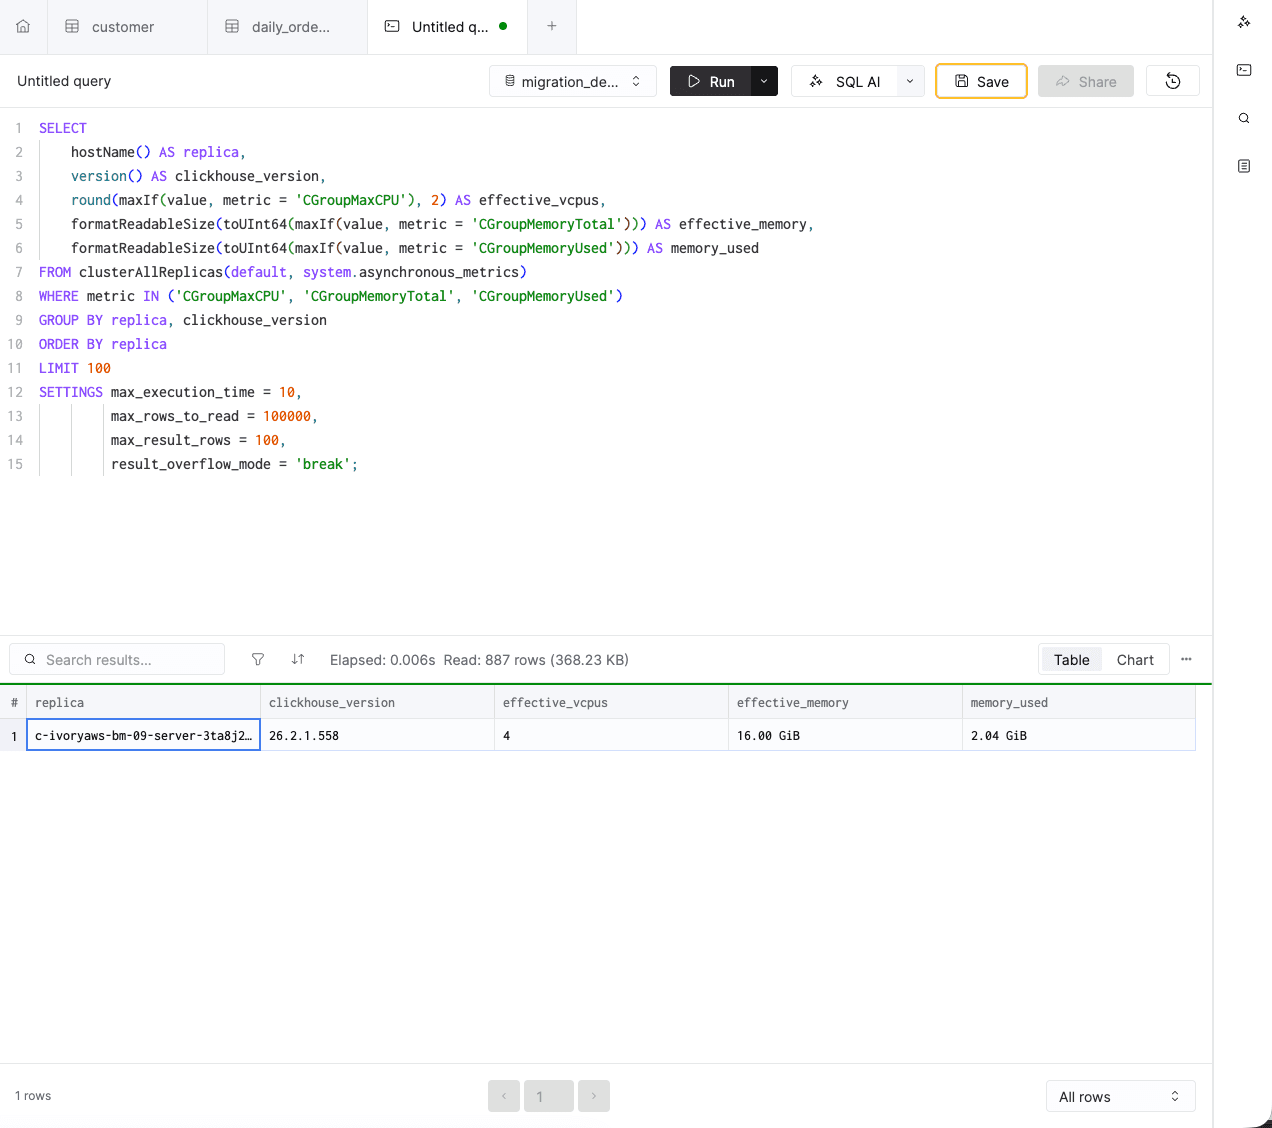
For the captured workshop run, the query reports one active replica with 4 effective vCPUs and 16 GiB of memory. Treat those values as evidence for this run only; every participant must record the result from their own service immediately before Step 5.
If the user cannot call clusterAllReplicas, replace that table expression with
system.asynchronous_metrics. The fallback reports the current replica only; obtain the
replica count separately from the ClickHouse Cloud service settings.
The SQL probe cannot report the configured autoscaling minimum/maximum, service tier, or cloud region. Record those control-plane values from the service settings. Complete this table with the query and console results; write platform managed or not exposed instead of guessing an instance type:
| Field | Databricks | ClickHouse Cloud |
|---|---|---|
| Service mode | Serverless SQL warehouse | Cloud service tier |
| Provisioned size | 2X-Small unless Terraform was overridden | Effective vCPU and memory per replica from SQL |
| Horizontal capacity | Cluster/concurrency scaling shown by Databricks | Number of rows returned by the all-replica query |
| Scaling bounds | Record what Databricks exposes | Configured min/max memory from service settings |
| Cloud and region | Workspace cloud and region | Service cloud and region |
| Scaling state | Warm/cold start and any scale event | Warm/idle-resumed and any scale event |
| Software | Warehouse channel/runtime | ClickHouse version |
The labels are not interchangeable hardware units. Databricks serverless abstracts the underlying hosts, while ClickHouse Cloud can scale replica memory vertically and replica count horizontally. See the official Databricks warehouse-sizing guide and ClickHouse Cloud scaling guide, then use the detailed benchmark-fairness reference when interpreting the result.
Copy this template into your workshop notes and fill it in before running Step 5:
Benchmark compute record
Databricks: serverless SQL warehouse; size=2X-Small; cloud/region=___;
  clusters/scaling=___; CPU/RAM=not exposed or ___; warm/cold=___; runtime=___
ClickHouse Cloud: tier=___; cloud/region=___; replicas=___;
  effective vCPU/replica=___; effective memory/replica=___;
  configured memory/replica min/max=___; memory used before run=___;
  warm/idle-resumed=___; version=___
Benchmark: concurrency=1; cache policy=___; timing type=___
Hardware context limits the claim
This workshop compares the services as configured; it is not a hardware-normalized or cost-normalized product benchmark. A speedup is defensible only with both compute records, the cache policy, and the exact query pair attached.
Run the comparison
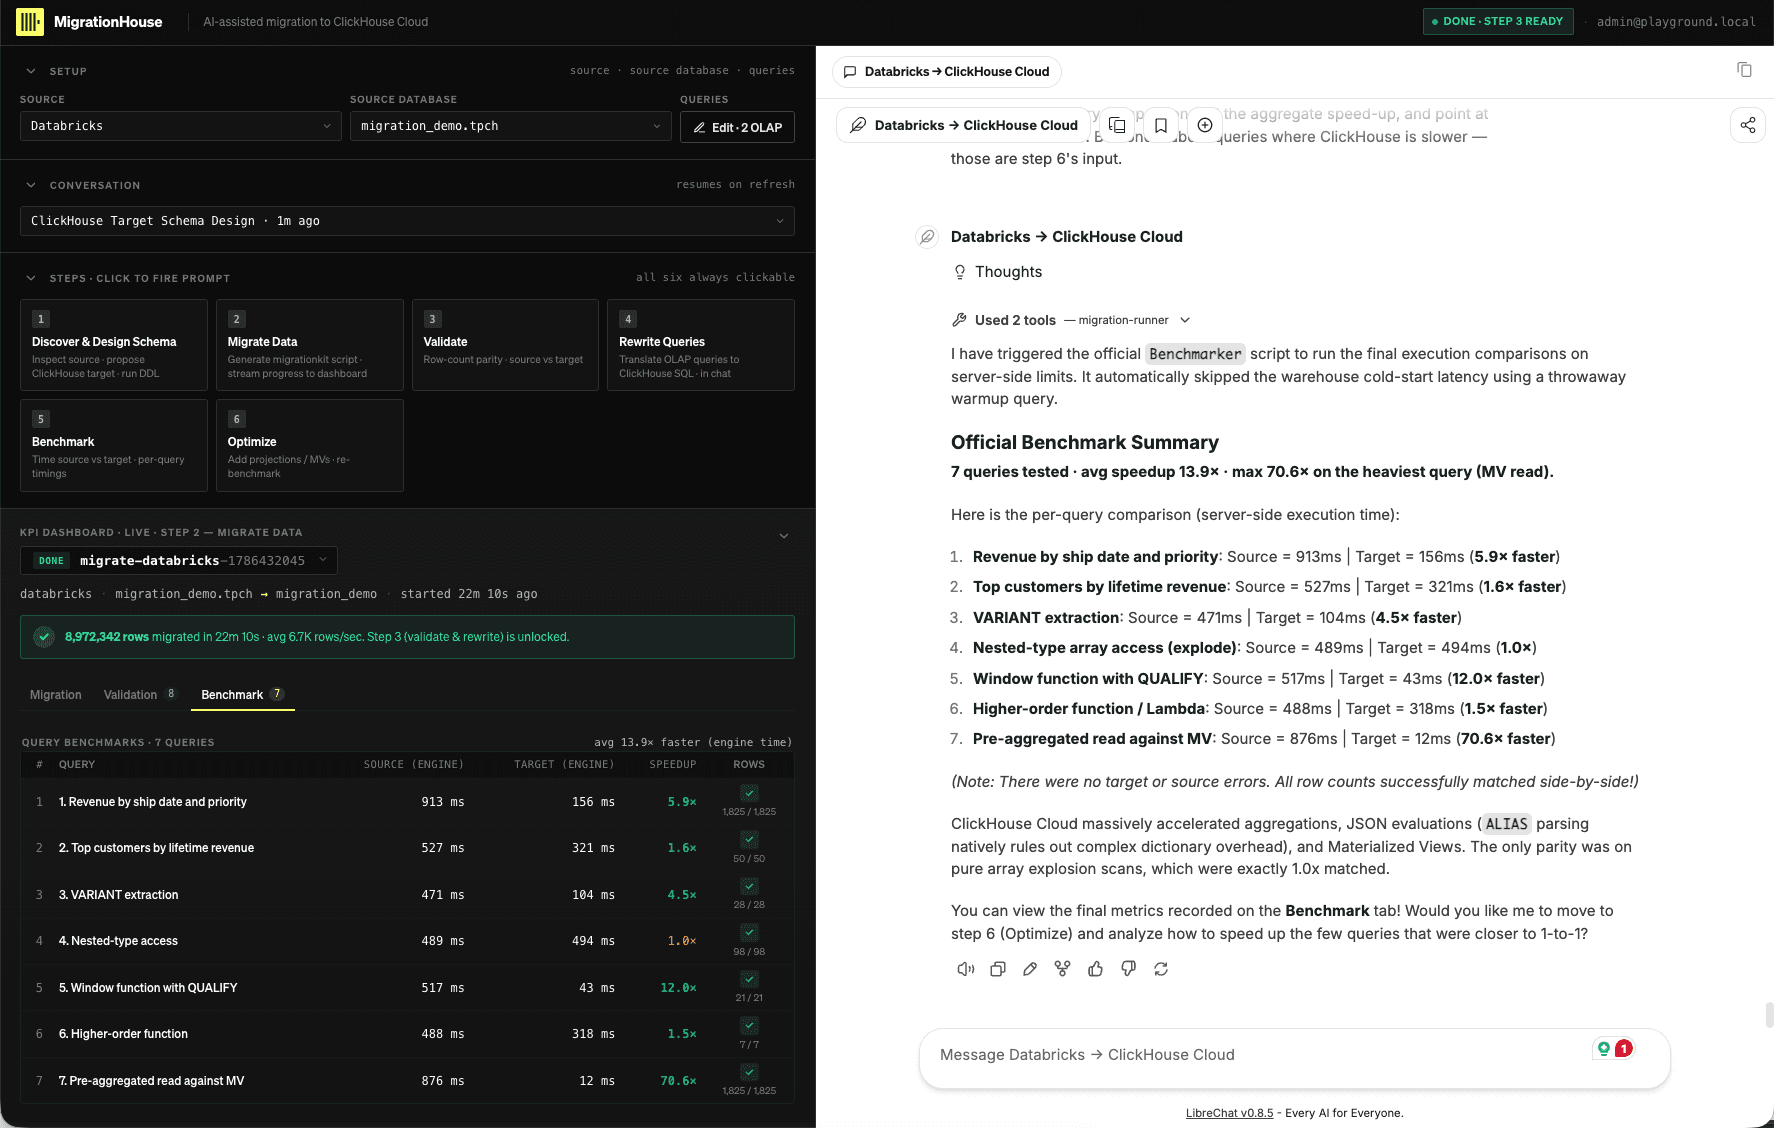
Click Benchmark. The agent pairs each original Databricks query with its ClickHouse rewrite and executes the comparison. Follow its tool activity in chat, then open the dashboard's Benchmark view for the durable per-query result.
Before interpreting latency, verify:
- both sides returned the same logical result and expected row count;
- the source query is fully qualified and the target query uses the migrated database;
- a Databricks cold start is either warmed with a throwaway query or clearly labeled;
- the UI distinguishes Databricks server time from wall-clock fallback; and
- no query was silently omitted because one engine failed.
This is a guided comparison, not a load test
The dashboard records the migration's per-query benchmark. Do not turn a single warm result into a universal throughput or concurrency claim. Keep service sizes, regions, cache state, and timing type beside any number you quote.
Ask the agent to interpret the result within the recorded compute envelope and identify the queries where ClickHouse did not win or won by less than expected. Those queries, their scans, and their current physical design are the input to Step 6. Do not describe the aggregate as hardware-neutral.
Use the chat copy-link button and capture the Benchmark view. Record the source and target timing for each query, timing type, cold/warm state, service configuration, and any failure. Preserve an unattractive result—it is more useful than a cherry-picked one.
- Step 5 used the same migration run and accepted query pairs.
- The ClickHouse system-metrics query captured effective vCPU, memory, and replicas.
- Databricks and ClickHouse compute, region, scaling, and warm/cold state were recorded.
- Correctness was checked before latency.
- Cold start and server-time/wall-time labels are explicit.
- Underperforming ClickHouse queries were identified for Step 6.
- The dashboard result and conversation link were retained.
Continue to 05 Query multiple catalogs.